


FinTech or Financial Technology refers to the utilization of software and modern technology to provide financial services

Social Media In FinTech Activities
2017 for Social Media in Fintech
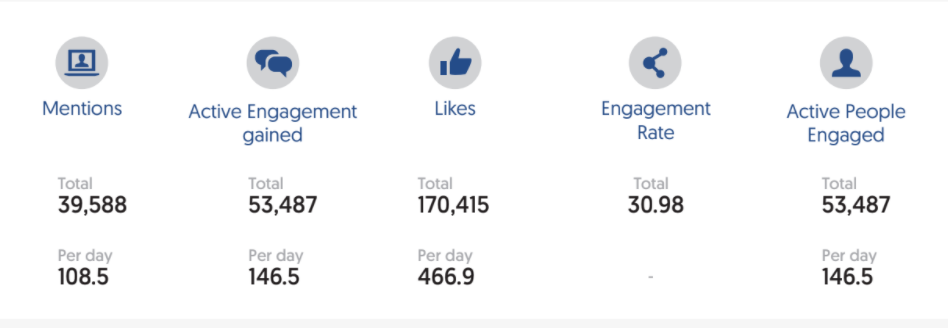
Overall, the Fintech social media activity in the MENA region is still very low compared to other industries. Yet, one cannot neglect the drastic improvement 2017 brings compared to 2016. In a nutshell, the number of interactions tripled from 2.5K to 8k in 2017.
Despite Fintech penetration being low in the MENA region, Fintech social accounts received more than 8K interactions in 2017, which is triple the number of interactions received in 2016. In addition to the rate of interactivity of users which indicates the increase in users’ interest in the industry, the number of unique users who tweeted and posted about Fintech has also undergone a huge change from 1.06K in 2016 to 34.9K in only one year. This huge jump of 35x means that more people were posting original content on Fintech. The increase in
Which Countries Contributed Most To The Fintech Buzz
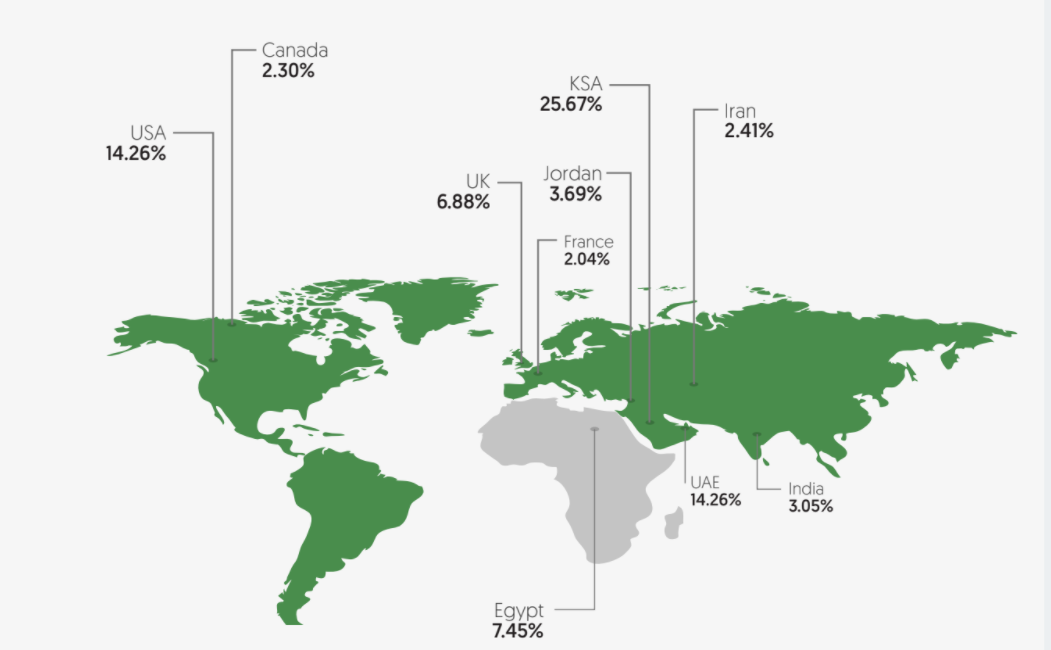
As the social media in Fintech has been through a huge growth in terms of activities within the MENA region, Saudi Arabia has undergone the highest growth rate in the region.
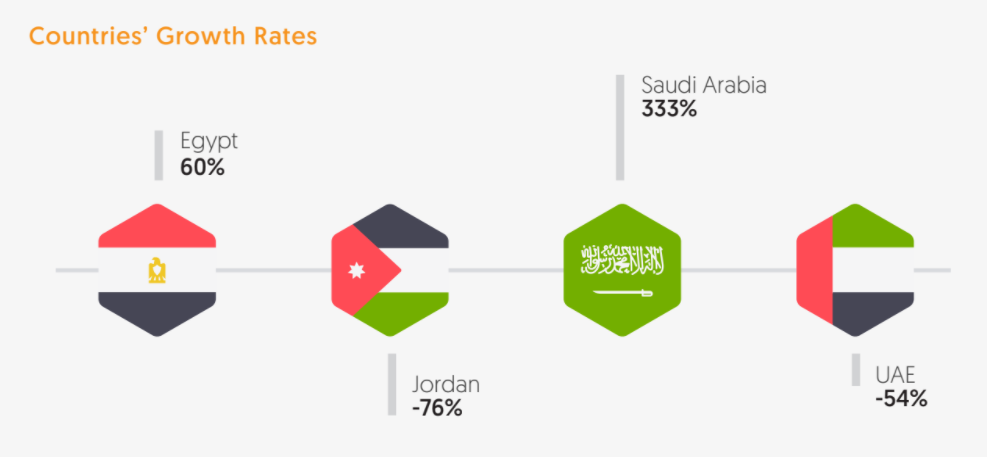
If we take a look at the Fintech online content, we will realize that Saudi Arabia had undergone a drastic growth from 6% to 25.67%, which is a 333% increase. UAE and Jordan had negative growth rates compared to 2016, Egypt had a modest growth of 60%.
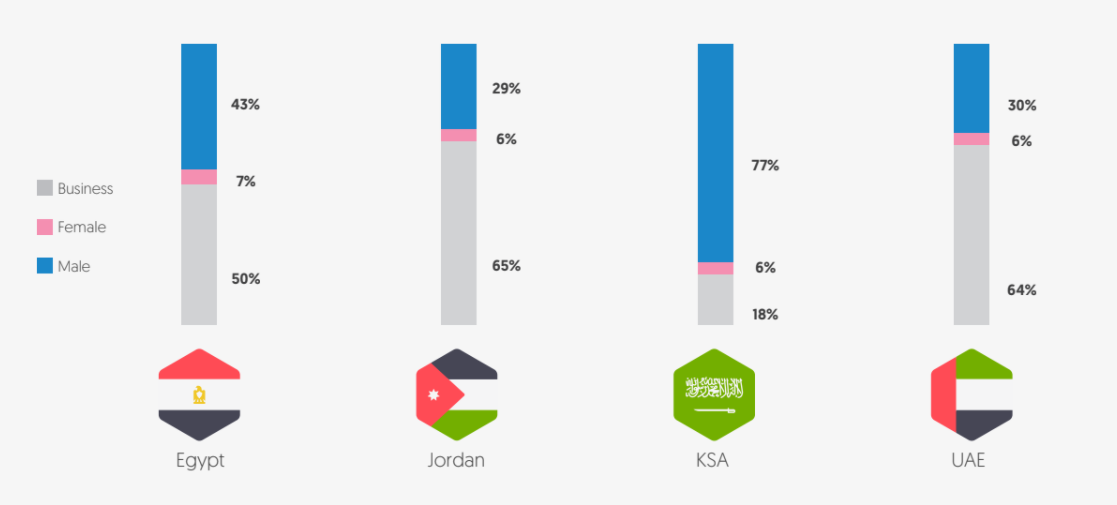
Males, Females, & Businesses… Which Contributed More? and Where?
On social media in
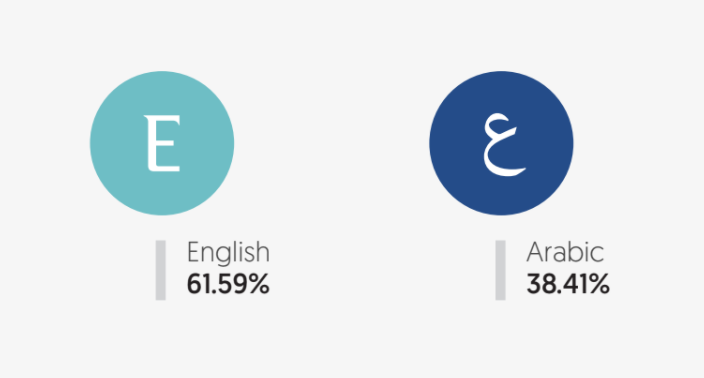
Which Language Was Used In The Fintech Industry?
Users in every country seem to be comfortable using a specific language even if it’s not their mother tongue. Although
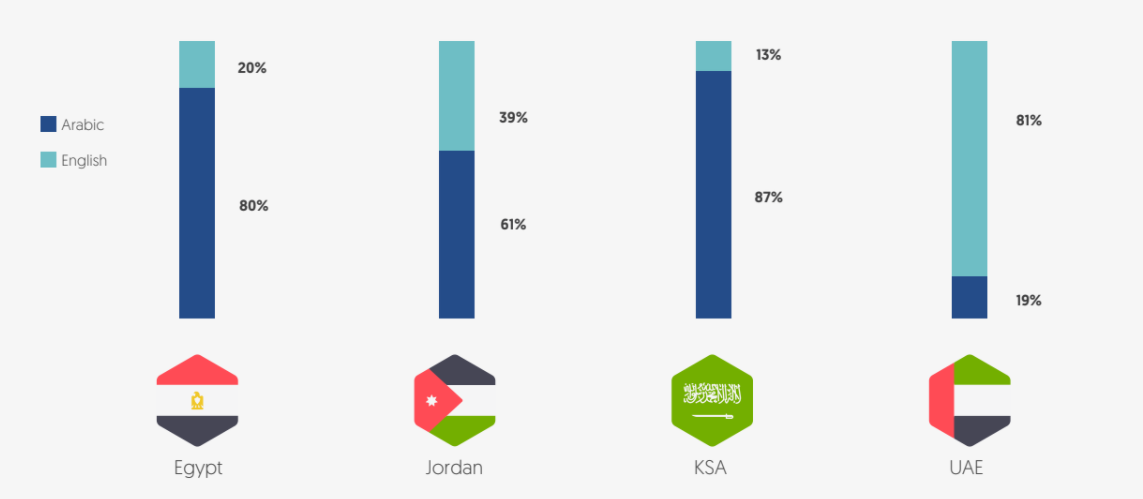
The majority of users across the region used Arabic to publish their content and tweet about Fintech services. Meanwhile, 81% of activities in UAE were published in English.
Are Users Satisfied?
One of the main perks of analyzing user-generated content on social media is collecting insights about users’ feedback. Since many users tend to post neutral content on social media platform, analysts and researchers eliminate
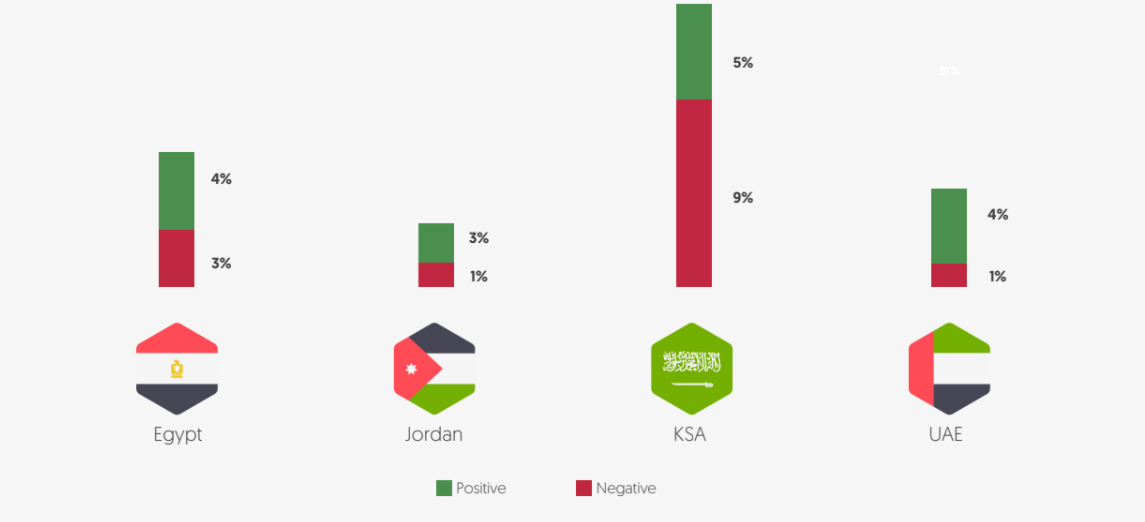
Users from Saudi Arabia published the highest number of sentimental posts, which composed 14% of Saudi Arabia’s activities about Fintech. On the other hand, Jordan was the lowest in sentiment, where no more than 5% of Jordan’s content about Fintech was sentimental at all.
As shown in the graph above, Saudi users weren’t very satisfied with the industry, unlike their counterparts in other countries, where the positive sentiment was dominating user-generated content. Positive dominated over all the countries except for Saudi Arabia where the negative sentiment was higher.
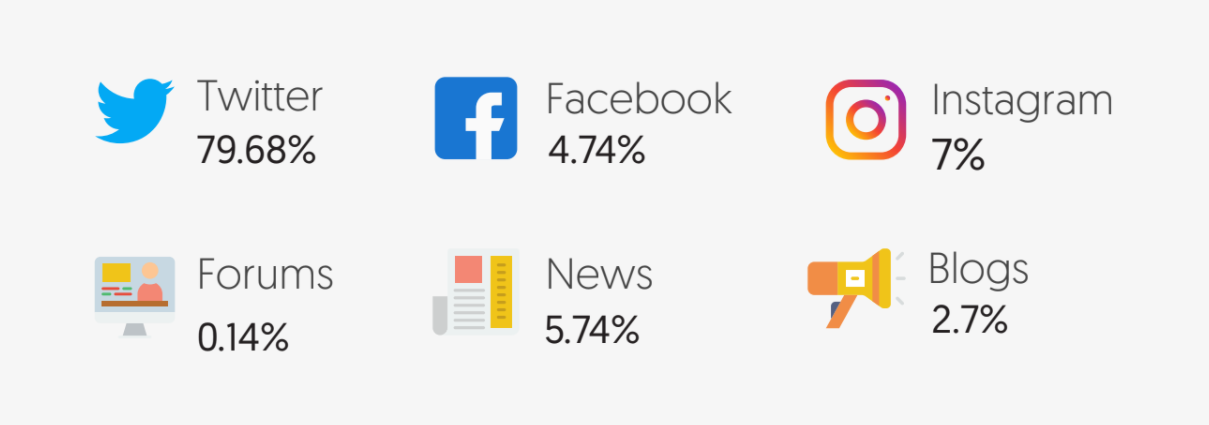
Which platforms were used in the industry?
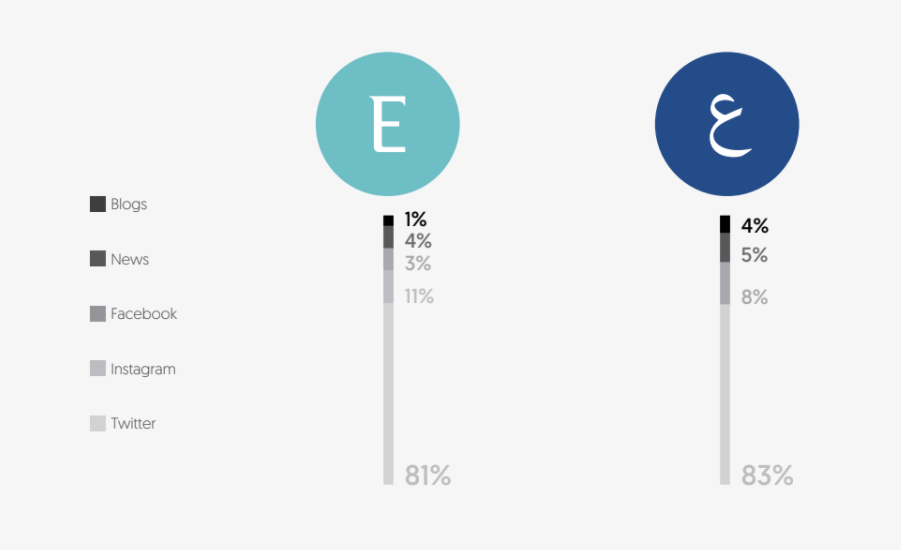
Almost 80% of activities were present on Twitter. Instagram came as the second most engaging platform with 7%. Thanks to public pages, Facebook was the 4th network and the 3rd most used social media platform in the buzz. When it comes to websites, news websites take the lead posting news articles about Fintech with a percentage even higher than Facebook’s public pages. Public forums were the least utilized by online users and businesses to talk about Fintech.
Which platforms were preferred by Personal accounts & Business accounts?
Overall, 2017 wasn’t much different from 2016 regarding gender participation. In 2016, most of the posts were created by business accounts and
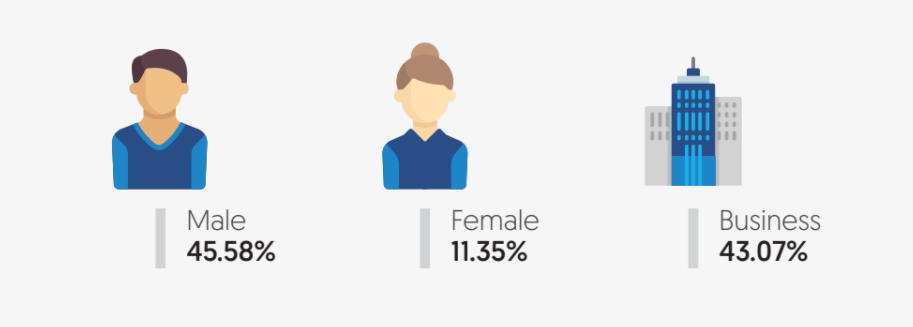
- Business Accounts
Business accounts dominated all activities in all channels except for Facebook and Twitter where activities were dominated by male users.
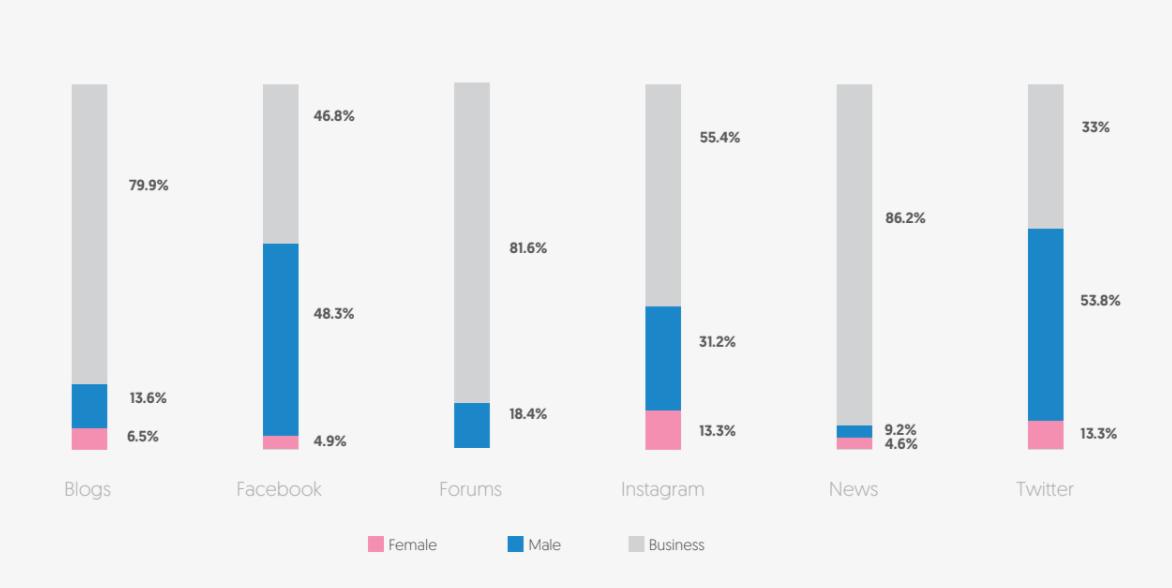
- Male Users VS. Female Users
Female users seem to be uninterested in Fintech, as their contribution to the activities of the industry did not exceed 11.5%. Male
- Did Sentiment Change From One Platform to Another?
.png?width=1047&name=9-1%20(1).png)
Most of
How Did The Sentiment Change Across Different Genders?
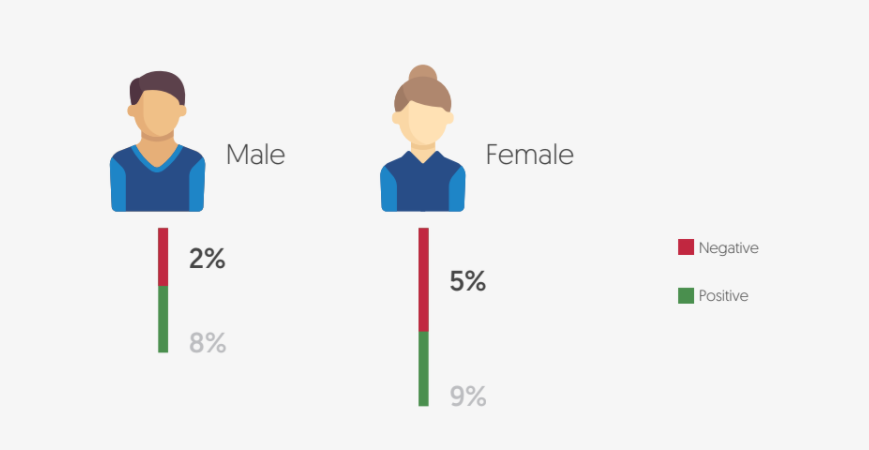
As mentioned earlier, we measure sentimental activities by eliminating neutral content. While positive is the dominating sentiment in all genders.
- Business Accounts
Business accounts did not publish any sentimental posts. As expected, business
- Male Users VS. Female Users
Male activities are more positive towards Fintech than females. In general, males are more sentimental than female having 11% of their activities with resembling an opinion compared to Females with 8%.
Language Preference Across Different Genders
Most genders
Unlike 2017, Arabic got 6 times more popular in the MENA region as it 38% of the published content was in Arabic, while no more than 6% of online content on Fintech was in Arabic in 2016. This might be an indicator that 2017 was a turning point for Fintech companies that started launching their services in Arabic as well.
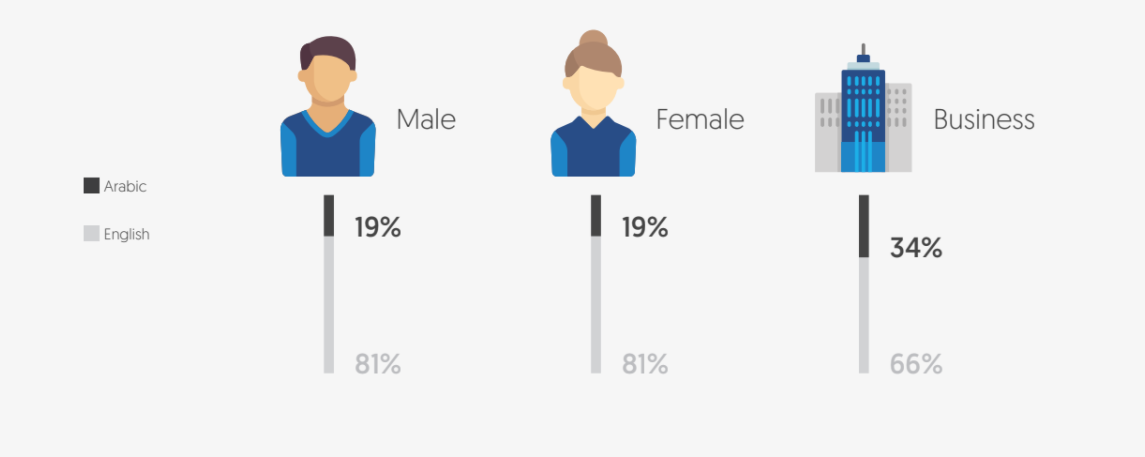
- Business Accounts
Business accounts, unlike male and female
- Male Users VS. Female Users
Male users and female users’ contributions were exactly the same as 81% of both genders
- Arabic & English Content
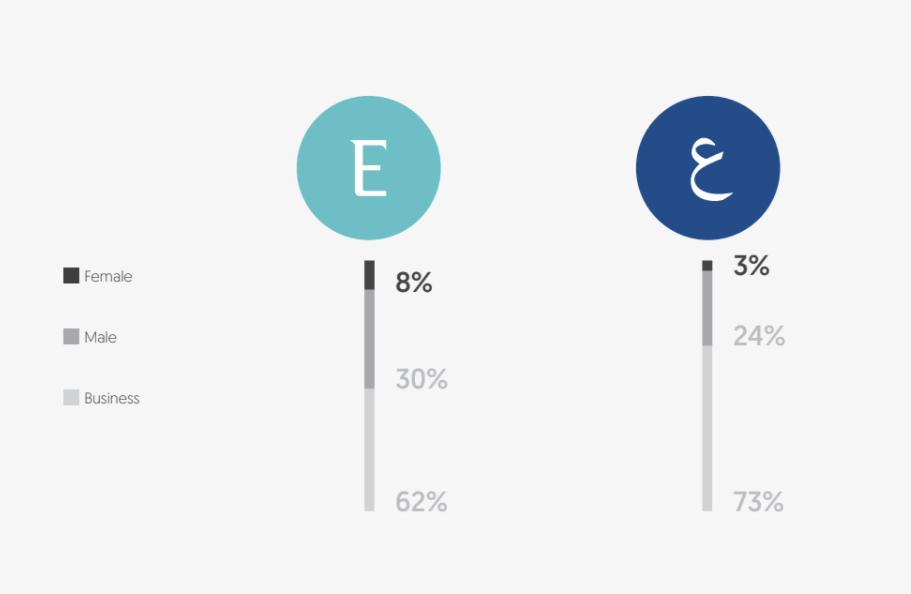
- How Did Genders Utilize English & Arabic?
Business accounts had already consumed most of the buzz in Arabic as well as English. Yet, When we analyze genders’ contributions to each language, we realize that activities in English were owned by business accounts with 62% followed by males with 30% and finally females with 8%. As per Arabic content, 73% of the activities were also published by business accounts followed by 24% by males and finally 3% female accounts.
Does Language Differ From One Channel to Another?
Twitter was the most used network in both languages on social media in
Check out more exciting insights in our recent blog article on social media in the Automotive sector which is also part of The State Of Social Media Report. With insights covering the overall state of social media within the Automotive sector in the MENA region.
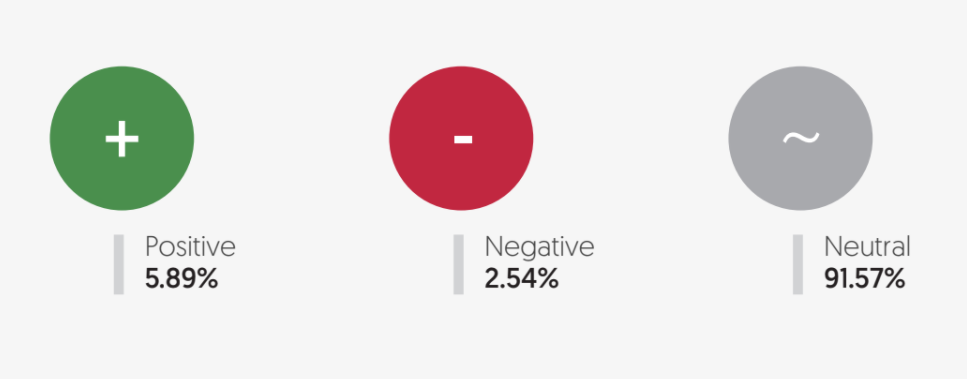
Sentiment Analysis of Fintech Content
Overall sentiment is neutral in 2017 similar to how it was in 2016. About 2.5% of the sentiment in 2017 was negative. While this is a low percentage, it is still important to address concerns of users with negative sentiment as this could turn into a negative campaign.
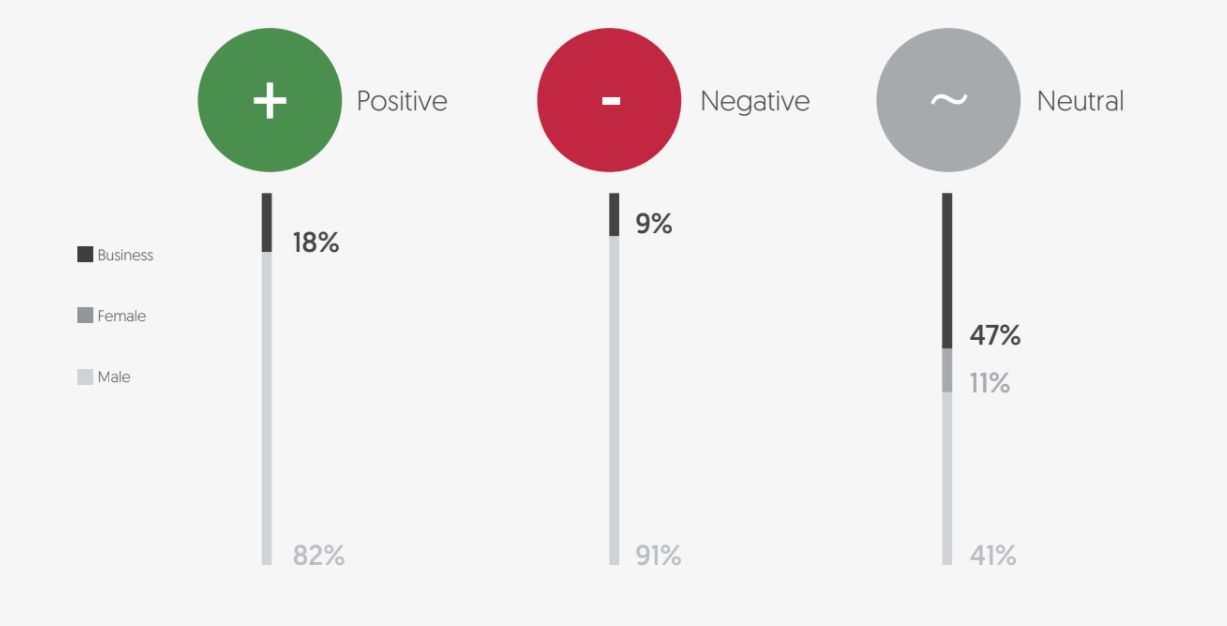
Which Sentiment Was Dominated By Which Gender?
Male users were more sentimental in their activities than females leading to male domination in both negative and positive content. But for neutral sentiment, business was the highest.
Was Sentiment Expressed Differently on Various Channels?
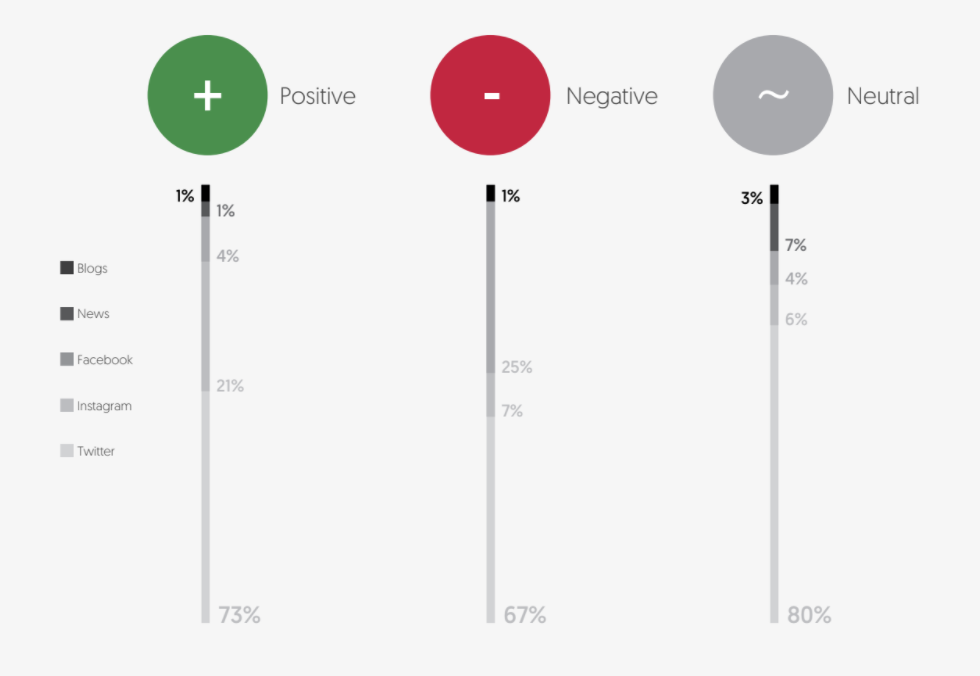
Twitter is the most sentimental channel. Moreover, Twitter users’ activities were more positive than negative towards Fintech topics on Twitter. On the other hand, news channels were the least sentimental.
Social Media in Fintech is only one of 8 industries that were covered by in the State of Social Media 2018. Download your free copy to access more data and insights.


.png?t=1539860263539&width=500&name=CrowdAnalyzer(500px_114px).png)